Sunday, January 31, 2010

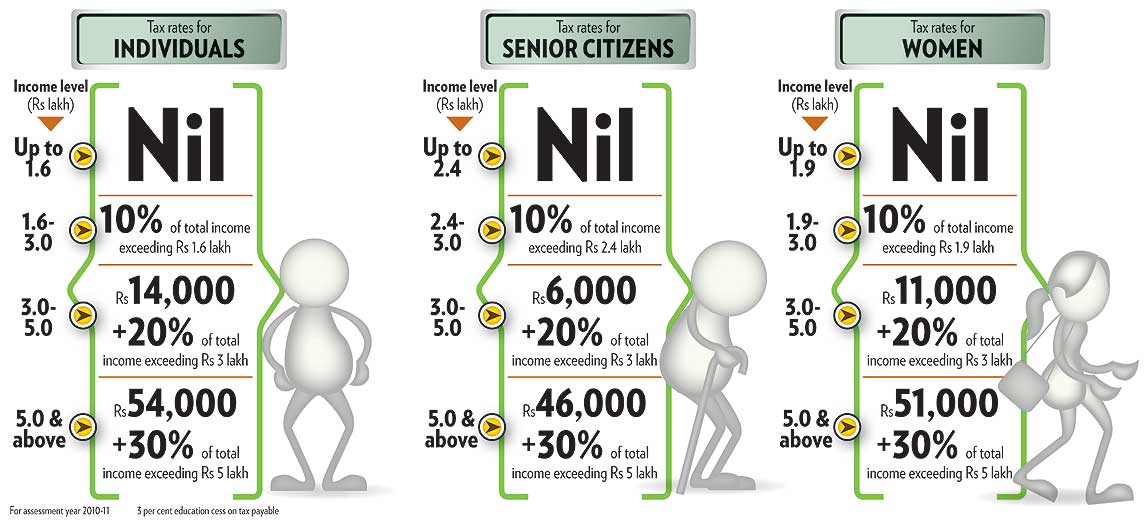
Tax Rates for FY 2009-10

It's that time of the year once again. Everyone must be wondering what is their tax liability and be scampering to save money from being taxed. Let us start by knowing which tax bracket do we fall in for this year:

Here is a pictorial presentation of the different tax brackets [courtesy: Outlook Money]:


How to arrive at Taxable Income?

Taxable Income = Income from (Salary + House Property + Capital Gains + Business/Profession + Other Sources) - Deductions under (Section 80 C + Section 80 D)

My next post will be about the various tax saving investments under section 80 C.
Read More...

Thursday, January 21, 2010

Dividend Delusion

An article from Valueresearchonline.com today: One of the most persistent confusions that mutual fund investors have is with the concept of dividends. Many fund investors seem to think that a mutual fund dividend is some sort of a bonanza, an extra bit of money that comes their way because of something special the fund has done. This is not a fringe belief, yet it is so pervasive that giving out dividends has long been a standard method of attracting new investments among fund companies. I have been told by senior sales people of more than one fund company that they even work out thumb rules to figure out how much dividend payout will bring in what amount of fresh investments under which conditions.
This propensity to choose funds based on their dividend payments is a major problem. It is a completely spurious factor with absolutely no merit in it. The only reason why this belief persists can well be that investors do not understand the arithmetic of mutual fund dividends and confuse them with corporate dividends. A mutual fund dividend is basically redemption of your investments in a fund. It (redemption) just happens to be called a dividend. To pay this dividend, the management simply sells off a part of the assets held in the dividend plan of a fund and pays off the proceeds as dividend.
Here's an example of the accounting. Let's say you own a thousand units in a fund with a net asset value (NAV) of Rs 30. Your investment is worth Rs 30,000. The fund declares a dividend of 10 per cent. That's 10 per cent of the Rs 10 face value of each unit. Thus, the dividend is Re 1 per unit. Since you own a thousand units, your total dividend amount comes to Rs 1,000. However, this money will simply be deducted from the residual value of your investment. To pay the dividend, the fund will sell off an appropriate proportion of its assets. When the dividend is paid out, the NAV of the fund will drop by Re 1 to Rs 29. The end result is that when you receive Rs 1000 as dividend, the value of your investment goes down from Rs 30,000 to Rs 29,000. Dividends have no impact on the return you are getting from your investment.
Receiving dividends does have a tax implication. In equity mutual funds, dividends can play a role in tax planning since equity dividend income is tax free. If you invest in a fund and immediately get part of the investment back as dividend then you'll have a loss on your capital. However, one has to hold an investment for at least three months to qualify for a tax set-off with that loss.
The most important thing is the basic non-dividend nature of mutual funds' dividend and that's something that investors must understand. Perhaps the problem is in the nomenclature. Till a few years back, new fund launches were called initial public offerings (IPOs). Then the Securities and Exchange Board of India (SEBI) forbade the use of that term because it led investors to mistakenly believe that new fund launches shared some of the characteristics of new stock offers. Now, new fund offers are called just that - NFOs.
While a similar renaming is unlikely in the case of dividends, knowledgeable investors should stop themselves from choosing funds on the basis of payouts.
Read More...

Tuesday, January 19, 2010

Skepticism: A tool to investing prowess!

Investing, as they say, is not difficult, but requires a little bit of effort.

Skepticism: By definition means, A doubting or questioning attitude or state of mind. If one maintains this doubting state of mind while making investment decisions as well, one can make some really calculated and good decisions.

Here are a few examples that Dhirender Kumar of Valueresearchonline gives for this:
let's say that a fund distributor wants you to buy a fund on the basis that it gave wonderful returns over the last six months. You could be impressed and just put down your money. Or, you could be sceptical, find out returns over different periods and calculate the effective rate of return, come to the conclusion that other types of funds would be better and invest in that alternative instead.

A perfect example would be when you are being sold a complex product, unit-linked insurance policies (ULIPs) being the perfect example. Typically, you will be told that you will pay charges under different heads like 'premium allocation', 'fund management', 'mortality charges' and so on. If you are not suitably empowered with both scepticism and arithmetic then you would just be impressed by the returns projections shown to you by the agent. On the other hand, if you were empowered with these two qualities, then you would reduce the entire stream of charges and payments and returns to a single rate of return. Then you would see how this rate of return would be impacted if the reality of market returns would prove to be a little less rosy than the insurance company's projections. Then, you would calculate whether buying the ULIP would be better, or buyin g a term insurance and investing somewhere else.

However, if you don't doubt others advice, you may end up buying things that are not as good for your future as they are for other's. So, be a skeptic, doubt/question whatever is told to you about any investment vehicle and then make your decision based on your own research.

Read More...

Sunday, January 17, 2010

Should you Invest Or Repay your Loans?

Found this article on Outlook Money (Dec 30, 2009 issue) and thought to share it on this platform.

The traditional wisdom says that you probably shouldn’t be investing while in debt unless you can reasonably expect to outperform the interest rates that you’re paying. In other words, if you’re carrying a high-interest debt, you should focus on getting out of debt instead of building your portfolio. This sounds simpler than it is.


What you should do will depend on two factors: the rate of after-tax interest that you are paying on your debt; and the after-tax return that you will be earning on your investments. Understand the types of debt and their impact on your financials.

One type of debt is the high-interest credit card debt, which is mostly used to meet comforts and luxuries, not needs. This kind of debt will eat your financials like a termite and should be avoided unless absolutely necessary.

The other type of debt is the lower interest rate variety, like housing loans, education loan, etc. Often the interest payable on these loans is either fully or partially tax-deductible, thus making them even more attractive.

If your cash flows support you in terms of meeting the debt prepayment and you still have surpluses, you can continue to invest and pay your debt at the same time. For example, you have a housing loan for which you are paying monthly EMIs. Treat this EMI as monthly rent and continue the debt, as you also get tax benefits for the interest portion on the housing loan. Invest the surplus in the asset type depending on your risk appetite. There’s certainly no harm in carrying the loan while building up your investments for the future. In fact, if you wait until you’ve paid off your loan over 15 to 20 years, you’ll find yourself in a very difficult situation by the time you turn your attention to the future. In case your cash flows are not very predictable, and you have surplus today, it will be better to clear the debt and reduce or zero your liabilities rather than investing the surpluses. Imagine a situation where you have invested in the market with the hope of generating returns that are more than what you are paying for the debt. Suppose the markets fell and your investments lost half of their value, while, at the same time, your cash flows took a hit. You will have a couple of painful choices to make—either you sell your investments at a loss and meet your commitments, or borrow afresh at a higher rate. It is better to clear your debts and then start your investments. The illustrations below will help you decide whether to continue the debt or to retire it.

Example I. You have an outstanding balance of Rs 50,000 on your credit card and you are paying 24 per cent annually and the interest is also not tax deductible. In such a situation, you should invest only if you think you can earn over 24 per cent per annum. Historically, the long term returns from equities have been around 18 per cent. It would be detrimental to your financial health to invest in a situation like this. So, clear the debt and use credit cards only if absolutely necessary.

Example II. You have a housing loan of Rs 20 lakh at 9 per cent, to be paid over 20 years. Let us also assume that you are in the 30 per cent tax bracket and as per current tax laws interest up to Rs 1.5 lakh is deductible from your taxable income. This will bring down the cost of your loan further. In such circumstances, it will be wise to continue your EMI of housing loan and the balance surplus is invested in long-term assets to generate returns higher than the interest cost.

What are you waiting for? Work out the numbers, see which is financially economical and just execute it even if it means you have to make a few painful decisions. Remember: “No pain, No gain”.


Read More...

Friday, January 15, 2010

Know your Credit Worthiness

You can now access your Credit Information Report (CIR) directly from CIBIL. As you may be aware, your CIBIL CIR is a factual record of your credit payment history compiled from information received from credit grantors. The purpose is to help credit grantors make informed lending decisions - quickly and objectively, and enable faster processing of your credit applications to help provide you speedier access to credit at better terms.

You can request for a copy of your CIBIL CIR in three quick steps through Email, Mail or Fax:


  1. Email the CIR Request Form duly filled in
  2. Mail self attested hardcopies of your lastest Identity Proof and Address Proof documents and Fees to P.O.BOX 17, Millennium Business Park, Navi Mumbai- 400710
  3. Once CIBIL receives the documents and Fees3, your request will be processed and copy of your CIR will be dispatched to you.
Letter: Address (mentioned at the end of the post)
  1. Write to CIBIL with the CIR Request Form duly filled in
  2. Also mail self attested hardcopies of your Identity Proof and lastest Address Proof documents and Fees to P.O.BOX 17, Millennium Business Park, Navi Mumbai- 400710
  3. Once CIBIL receives the documents and Fees, your request will be processed and copy of your CIR will be dispatched to you.
Fax: 022-40789007
  1. Fax CIBIL the CIR Request Form duly filled in
  2. Mail self attested hardcopies of your Identity Proof and latest Address Proof documents and Fees to P.O.Box 17, Millennium Business Park, Navi Mumbai 400710
  3. Once CIBIL receives the documents and Fees, your request will be processed and a copy of your CIR will be dispatched to you.

Valid Identity Proof: PAN Card/ Passport/ Voters ID (Mail self attested hard copy of any one of these Identity Proofs)

Valid Address Proof: Bank Account Statement/ Electricity Bill/ Telephone bill (Mail self attested hard copy of any one of these Address Proofs)

Payment terms: Demand Draft (DD) of Rs 142/- (inclusive of all taxes and express delivery charge) , in favour of Credit Information Bureau (India) Limited payable at Mumbai

 
Please note that the fee once paid is non-refundable.


CIBIL has no authorised agents. Please do not contact anyone other than CIBIL in order to gain access to a copy of your Credit Information Report.

 
Your CIBIL CIR will be presented to you in a simple and easy to understand format. However, on receiving your CIBIL CIR, if you require any explanation/clarification, you can email us at consumerqueries@cibil.com.


* Credit Information Bureau (India) Limited

P.O Box 17,

Millennium Business Park,

Navi Mumbai- 400710

 
All your correspondence to CIBIL must be sent through Indian Post only.
Read More...

Wednesday, January 13, 2010

Tips to tackle Inflation

Inflation as we have discussed, is bad. It affects your buying power as well as it hurts your investments. This is because, the interest on your investments is now worth less than what you were expected to get. The hardest hit are the retired people, who are risk averse and have most of their investments in fixed income instruments.

Inflation adjusted rate: ((1+i)/(1+r))-1 x 100


Here, i is the interest rate and r is the inflation. Thus, an interest rate of 10% would reduce to 3.77% if inflation is 6%.

Here are a few tips to leash the monster called inflation:

  1. Choose investments with returns greater than the rate of inflation.


  2. Select investments with tax deferral of contributions and earnings.


  3. With many retirements now lasting 15 to 30 years, retirees should choose investments that will hedge against inflation. The best ones would be capital indexed bonds, whose returns are linked to inflation.


  4. Look for instruments with highest interest rate and shortest maturity.


  5. Review the limits of your insurance coverage’s periodically, especially homeowners, renters, and umbrella coverage.


  6. Don’t buy into the argument that it is better to borrow and spend money now, paying the debt later with “cheaper” money.

Fixed Income Laddering - This is an inflation tackling strategy where one invests in fixed income securities over fixed periods. Equal amounts must be put in fixed time intervals (for example 2, 3, 5 year FDs). It gives you:

  • a steady income stream


  • money that is not locked for long durations (gives you the ability to invest in better returns options)


  • freedom to adjust your investments as per the financial and market situation.


Read More...

Monday, January 11, 2010

How does India calculate Inflation?


Continuing from the last post, I'll try to discuss how India calculates Inflation and how is that different from the rest of the world. But first let's discuss what is Wholesale Price Index (WPI) and Consumer Price Index (CPI).

Wholesale Price Index - WPI was first published in 1902, and was one of the more economic indicators available to policy makers until it was replaced by most developed countries with the Consumer Price Index in the 1970s.

WPI is the index that is used to measure the change in the average price level of goods traded in wholesale market. In India, a total of 435 commodities data on price level is tracked through WPI which is an indicator of movement in prices of commodities in all trade and transactions. It is also the price index which is available on a weekly basis with the shortest possible time lag only two weeks. The Indian government has taken WPI as an indicator of the rate of inflation in the economy.

Cosumer Price Index - CPI is a statistical time-series measure of a weighted average of prices of a specified set of goods and services purchased by consumers. It is a price index that tracks the prices of a specified basket of consumer goods and services, providing a measure of inflation.


CPI is a fixed quantity price index and considered by some a cost of living index. Under CPI, an index is scaled so that it is equal to 100 at a chosen point in time, so that all other values of the index are a percentage relative to this one.

India is the only major country that uses a wholesale index to measure inflation. Most countries use the CPI as a measure of inflation, as this actually measures the increase in price that a consumer will ultimately have to pay for. WPI does not properly measure the exact price rise an end-consumer will experience because, as the name suggests, it is at the wholesale level.

WPI is basically helpful to measure the inflation at business level but we are using this to measure the inflation at consumer level. Moreover, it doesn't take into account most of the services relevant to today's consumer since it was last updated in 1993-94.

What should we do to counter inflation? Wait till the next post...
Read More...

Saturday, January 9, 2010

The monster of Inflation

Inflation has been a big cause of concern world over in the recent past, especially in India. So, I thought to present a crash course on this topic today. My source is obviously the ever-expanding Internet.

In economics, inflation is a rise in the general level of prices of goods and services in an economy over a period of time. When the price level rises, each unit of currency buys fewer goods and services; consequently, inflation is also an erosion in the purchasing power of money – a loss of real value in the internal medium of exchange and unit of account in the economy. A chief measure of price inflation is the inflation rate, the annualized percentage change in a general price index (normally the Consumer Price Index) over time.[source]

Inflation is a world problem. Here is a view of inflation all over the world.


 So, what causes Inflation? Why do prices rise? Many people mistakenly believe that prices rise because businesses are "greedy". This is not the case in a free enterprise system. Because of competition the businesses that succeed are those that provide the highest quality goods for the lowest price. So a business can't just arbitrarily raise its prices anytime it wants to. If it does, before long all of its customers will be buying from someone else.


It is actually the supply on money in the market that increases the prices!!! Yes! Prices of comodities rise because people have more money to spend and hence are willing to pay more for the same thing. In other words, with more money supply or monetary inflation (govt printing/minting more Rupees), everyone has more money in their pockets and that results in buying more. Basically when the government increases the money supply faster than the quantity of goods increases we have inflation. Interestingly as the supply of goods increase the money supply has to increase or else prices actually go down. The basic Demand and Supply theory we read in class 12!!

How does India calculate Inflation? Well, that is for the next post!!! Keep checking this space...


Read More...

Sunday, December 27, 2009

Understanding SIP


You Earn Regularly…
You Spend Regularly…
Do You Invest Regularly?


Systematic Investment Plan (SIP), is a is a simple and time honored investment strategy for accumulation of wealth in a disciplined manner over long term period.

SIP or systematic investment planning is method through which you can invest in mutual funds through small and periodic installments. Infact you can invest as low as Rs. 1000/- on a monthly basis. Moreover you can also select the tenure of the instalments.

The systematic style of investing is actively promoted by practically everyone who gives advice about fund investing. Whether these are fund companies, advisors, or the media, an SIP is supposed to be the holy grail of mutual fund investing. Unfortunately, there seem to be a growing number of investors who have cottoned-on to the notion that SIP investing is some sort of magic. There are two widespread misconceptions about SIPs: some investors believe that an investment through the SIP route cannot have poorer returns than a lump-sum investment made at the same time that the SIP was started. The other, more extreme point-of-view is that you can’t make a loss in an SIP, no matter what. Both are equally wrong.

The basic idea behind an SIP is that while the general direction of an investment (a fund or even a stock) is upwards, it is not possible to reliably predict the actual fluctuations that it may undergo as part of its general trend. Instead of trying to time one’s investments, one should regularly invest a constant amount. As time goes by and the investment’s net asset value (NAV), or market price, fluctuates, it will automatically ensure that when the NAV was low, you ended up purchasing a larger number of shares or units. Eventually, when you want to redeem your investment, all the units are worth the same price. However, because your SIP meant that you bought a larger number of units whenever the price was low, your returns are higher than they would otherwise have been.

There is another reason why SIPs make sense. They are a great way to override the normal psychological instinct to stop investing when prices fall. In my experience, this is the real value of SIPs. The normal tendency is to invest more when prices are high and to stop investing when prices fall. This is the opposite of what is the most profitable way of investing. SIPs force you to follow the opposite approach, much to your eventual benefit.

Read More...

Wednesday, December 9, 2009

4 Key Ratios for Fundamental Analysis of stocks

Hi Friends,

It has been quite a few days that I last wrote about the Fundamental Analysis (see EPS). I was pretty busy with the regular work and couldn't devote time to this blog.

Today, I have decided to give a shot at other important financial ratios that should be considered while buying/selling stocks. I have decided to put 4 of them in a single post as against my original wish to devote a separate post for each one. This is to avoid people waiting for my posts to get the basic knowledge when I'm not getting time to update the website.

The ratios that we will discuss today will be:

  1. Price-to-Earnings Ratio (PE)
  2. Projected Earnings Growth (PEG)
  3. Price-to-Sales Ratio (PS)
  4. Price-to-Book ratio (PB)

Price-to-Earnings Ratio (PE)

This is the ratio of the current stock price to the Earnings of the company. This is one of the most popular ratios discussed around the market.

P/E = Stock Price/Earnings Per Share

This value gives you an idea of how much the market ready to pay for every Rupee that the company in question earns per outstanding share in the market. A high PE thus means that the company is overpriced, but it also means that market in general is willing to take more risks on this company as it thinks that this is a good company with bright future.

A lower P/E on the other hand may mean that the company doesn't have the market's confidence and hence is trading at a relatively lower price. This may also mean that the company is being overlooked by market players right now and could be a real asset when it gets market's eye.

I myself don't have an answer of what is a right PE ratio, it generally depends on how much are you willing to pay for a company. I generally treat a PE of under 12 to be fairly valued company.

Projected Earnings Growth (PEG)


This is another ratio that you can use to check the future earnings growth of the company. PEG is used to calculate the inbuilt worth of the share. To derive the ratio, you have to associate the P/E ratio with the expected growth rate of the company. It assumes that higher the growth rate of the company, higher the P/E ratio of the company’s shares. Vice versa also holds true.

PEG = (P/E)/Expected EPS growth rate

For example, a stock with a P/E of 30 and projected earning growth next year of 15% would have a PEG of 2 (30 / 15 = 2). The lower the number the less you pay for each unit of future earnings growth. So even if a stock has a high P/E, but high projected earning growth may be a good value. In general, a PEG lesser than 0.5 is a lucrative investment opportunity. However if the PEG exceeds 1.5, it is time to sell.


Price-to-Sales Ratio (PS)

The above 2 were the ratios where the company has earnings history. What if the company you are looking at is new and has no earnings  history? You can use P/S to measure such a share. It looks at the current stock price relative to the total sales per share. You calculate the P/S by dividing the market cap of the stock by the total revenues of the company.

You can also calculate the P/S by dividing the current stock price by the sales per share.

P/S = Market Cap / Revenues
or
P/S = Stock Price / Sales Price Per Share

Much like P/E, the P/S number reflects the value placed on sales by the market. The lower the P/S, the better the value, at least that’s the conventional wisdom. However, this is definitely not a number you want to use in isolation. When dealing with a young company, there are many questions to answer and the P/S supplies just one answer.

Price-to-Book ratio (PB)
You calculate the P/B by taking the current price per share and dividing by the book value per share.


P/B = Share Price / Book Value Per Share

Like the P/E, the lower the P/B, the better the value. The Book Value per Share is calculated as follows:

Book Value per Share = Shareholders' funds/Total quantity of equity shares issued

Shareholders' funds = Total assets (equity capital to the company's reserves) - Total liabilities (money owed to creditors)

Value investors would use a low P/B is stock screens, for instance, to identify potential candidates.

Hope you ind this information useful. If so, you can subscribe to our regular updates in you email by clicking here.
sources:
  1. http://stocks.about.com/od/evaluatingstocks/a/Fundanatools1.htm
  2. http://wealth.moneycontrol.com/yourstartupkit/equity-investing/8-key-ratios-while-buying-stocks-/14152/0
Read More...

Disclaimer

All data and information provided on this site is for informational purposes only. The author makes no representations as to accuracy, completeness, currentness, suitability, or validity of any information on this site and will not be liable for any errors, omissions, or delays in this information or any losses, injuries, or damages arising from its display or use. All information is provided on an as-is basis.